The Cost of Carbon: What is the price of reducing your carbon footprint?
The “cost of carbon” has become a common term in the climate change ecosystem, but the nuances often get lost in the melee of decarbonization discourse. There are many uses for the term “cost of carbon”, from quantifying social impact to cap-and-trade tax systems. This discussion will focus on applying costs of carbon to identify the best use of decarbonization capital. When there are many options to decarbonize, how can the “cost of carbon” be used to minimize the price of impactful decarbonization? Below, I disambiguate the “cost” and “carbon” aspects of the cost of carbon. Then, we will recombine them in the real-world context of selecting a new personal vehicle.
We can generally understand “cost” to indicate the exchange of one thing for another. For the sake of this discussion, cost refers specifically to the per-unit dollar value for some quantity of an item or action. If a company were contemplating building a new factory to create widgets (a generic product for achieving some task), cost would represent the total dollar value required to make one widget. This would include capital costs like the upfront cost to purchase the widget-making machines, and operating costs such as the raw materials for the widget itself, the electricity bill to power the widget-making machines, labor costs for workers to operate the widget-making machines, annual property taxes on the widget factory land, and various other costs associated with manufacturing. The calculation of this cost is often performed using techno-economic analysis (also known as TEA), where you begin by defining the process for what you want to build or produce, including mass and energy balances, and then build up costs for each part of the process. You include both operating expenses and capital costs in this calculation. The result of TEA is a unit cost, or $ per widget, for the process of interest.
The next important step in understanding the cost of carbon is defining what exactly “carbon” means. At a high level, “carbon” conveys the concept of carbon footprint, or more simply, how much carbon a product or action emits. But what does this “carbon” include? Typically, “carbon” is a shorthand for carbon dioxide (CO2), which is the most common greenhouse gas (GHG) associated with climate change.[1] CO2 is emitted during many modern industrial activities, such as combusting gasoline in our cars or burning coal for power. While CO2 is the most common GHG, other gases, such as methane or nitrous oxide, similarly insulate the planet when present in the atmosphere. Some of these GHGs are better at insulating the Earth than others, and this phenomenon is described by each gas’s Global Warming Potential (GWP) value. GWPs are published by the United Nations Intergovernmental Panel on Climate Change (IPCC), which distributes periodic updates based on the best, most recent available data. The latest GWPs were published in the Fifth Assessment Report (AR5) in 2014.[2] GWPs are specified for a given time horizon, often 100 years; this results from the fact that many GHGs will decompose over time in the atmosphere, at differing rates depending on the gas, reducing their insulating ability. For instance, methane’s GWP is 80 times that of CO2 over a 20-year horizon, but only 28 times over a 100-year horizon. Specifying a time period thus enables incorporation of both the gas’s initial insulating ability and its decay over time. For the sake of comparing all the gases that contribute to global warming, GWPs are typically defined in CO2 equivalents (CO2e), which normalizes all gases relative to CO2. “Carbon” thus represents not only CO2, but all GHGs that have a similar planet-warming effect, normalized to CO2e for a given period.
We discussed how TEA is used to derive unit cost, but how do we allocate carbon on a per-unit basis? The attribution of GWP to a specific process is often calculated using lifecycle assessment (LCA), which aims to assess all environmental impacts of a product or service. LCA can generate information about water impacts, particulate emissions, solid wastes, and GHG emissions. While both TEA and LCA focus on a per-unit basis, they differ in that TEA calculates cost while LCA sums GHG emissions (or other environmental impacts). Like TEA, LCA calculation requires a defined process that specifies all inputs, the lifecycle system boundary being assessed, and all system outputs. Software tools, such as Sphera or ecoinvent, provide curated, validated datasets of emissions factors for these various raw materials, energy inputs, and products, which enables the summation of emissions associated with the defined process. Ultimately, one output of this analysis will be a GWP in CO2e normalized to a unit of product or service. Going back to the widget factory, the LCA would calculate a carbon footprint on a per-widget basis, typically reported normalized in kilograms or metric tonnes of CO2e per widget. This carbon footprint value represents all the GHG emissions, CO2, and others, associated with the widget’s lifecycle (cradle-to-grave).
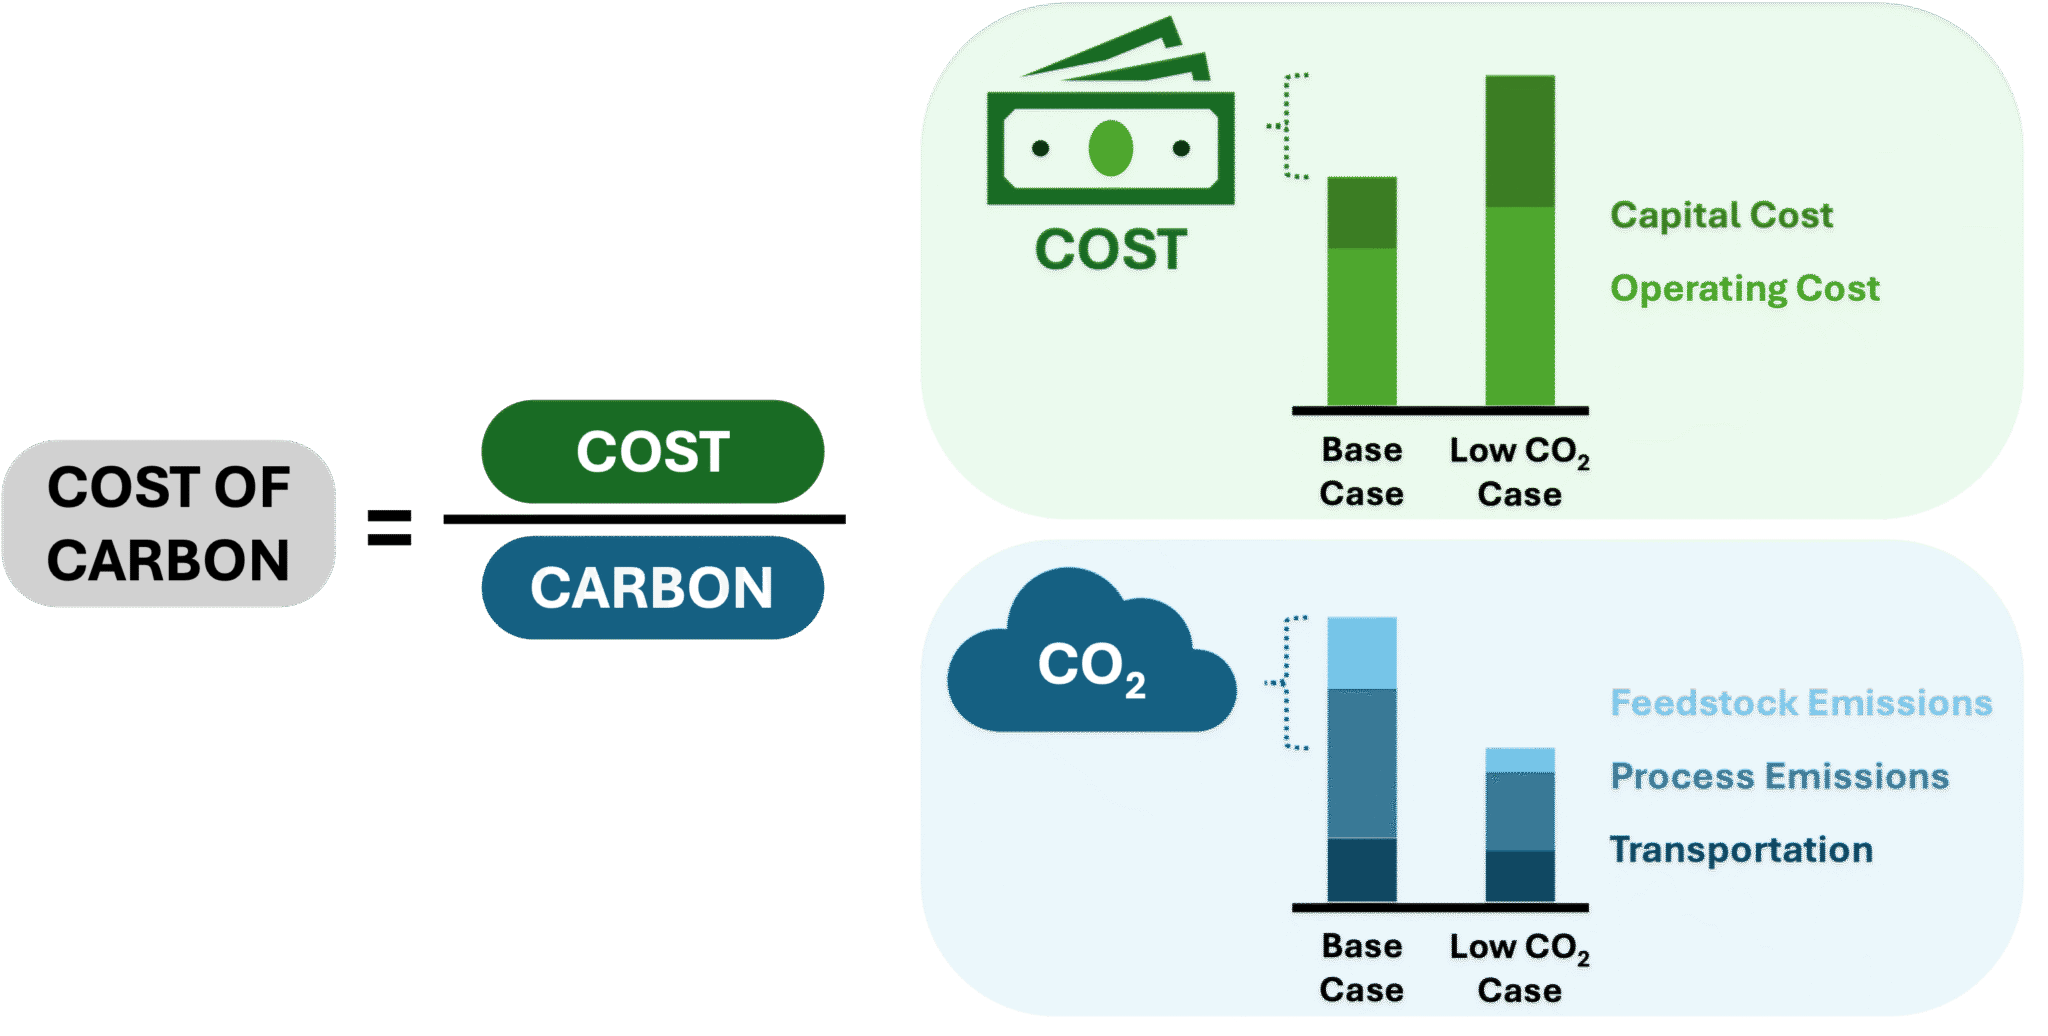
Now that we understand both “cost” derived from TEA and “carbon” calculated using LCA, we can look at an example to demonstrate their combined utility. Let us pretend that I need to buy a new car. Let us also assume I am interested in lowering my carbon footprint by choosing a plug-in hybrid vehicle (PHEV) or a fully battery electric vehicle (BEV). From a cost perspective, which is the better option to reduce my global warming impact? The first step is to identify the base case, or the ‘business as usual’ option where there would be no change in carbon footprint. Inherent to the use of this base case is the assumption that decarbonization incurs additional cost. In the personal vehicle case, this would be a standard internal combustion engine (ICE) car. Compared to the ICE car, these PHEV and BEV options present additional costs and GHG emissions reduction benefits (represented graphically as the “Low CO2 Case” in the figure above). The “cost” and “carbon” values for ICE, PHEV, and BEV options are summarized in the table below. We can calculate the incremental cost and GHG emissions reductions for the lower-carbon PHEV and BEV options with these values. Dividing the cost of each option by the CO2e savings then provides a cost of carbon, from which we can conclude that the BEV represents the most cost-effective way for me to reduce my carbon footprint, even though its initial cost (MSRP) is the highest and its total cost of ownership is higher than the ICE option. This conclusion highlights that the cost of carbon is an economic- and GHG-focused approach and does not consider other implications of the decision (potential inconvenience of battery charging stops if you are fond of long road trips, for example). However, the benefit of this simplified metric is that you could start comparing decarbonization options across the board. For instance, you could compare carbon costs for buying a BEV versus replacing all the incandescent lightbulbs in your house with more energy-efficient LEDs. The opportunities are endless for decarbonization, and the cost of carbon gives you a measuring stick to pick the most impactful use of your dollar.
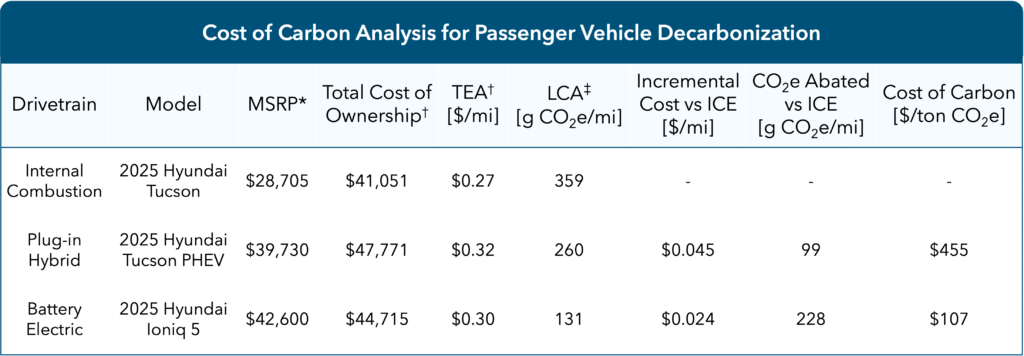
* MSRP as show here does not include any government tax credits or subsidies for electric vehicles. If available, such incentives serve to reduce the consumer cost of decarbonization.
† Total Cost of Ownership and TEA include capital costs (MSRP minus estimated depreciated value after 10 years) and operating costs (power input cost as gasoline, power, or both). This represents a high-level analysis and does not include maintenance or financing costs. Other assumptions include: 10 years of ownership, 15,000 miles driven annually, and a 30% electric utility rate for PHEV. Depreciation values were estimated based on a recent literature report from Roberson et. al.[i] Gasoline prices were linearly extrapolated from historical EIA data for Conventional, Regular Grade gasoline. Electricity prices were similarly extrapolated from historical St. Louis Federal Reserve data for average residential power costs.
‡ LCA values were taken from the IEA EV Life Cycle Assessment Calculator.[ii] Assumptions for the United States and a medium vehicle size were used. Defaults were used for all other values.
Though highly simplified, hopefully this deconvolution of “costs” from techno-economic analysis and “carbon” from lifecycle analysis serves to highlight the “cost of carbon” as one of many tools we can use to down-select decarbonization options with respect to price. In a world of limited monetary resources and a desire to reduce GHG impacts on climate change, carbon cost can be powerful in identifying how to most economically minimize your carbon footprint.
References
[1] CO2 is the most common GHG emitted according to 2022 analysis by the EPA. https://www.epa.gov/ghgemissions/overview-greenhouse-gases
[3] https://iopscience.iop.org/article/10.1088/1748-9326/ad3fce/pdf
[4] https://www.iea.org/data-and-statistics/data-tools/ev-life-cycle-assessment-calculator